Analysis of Solar Images taken by MAST Telescope
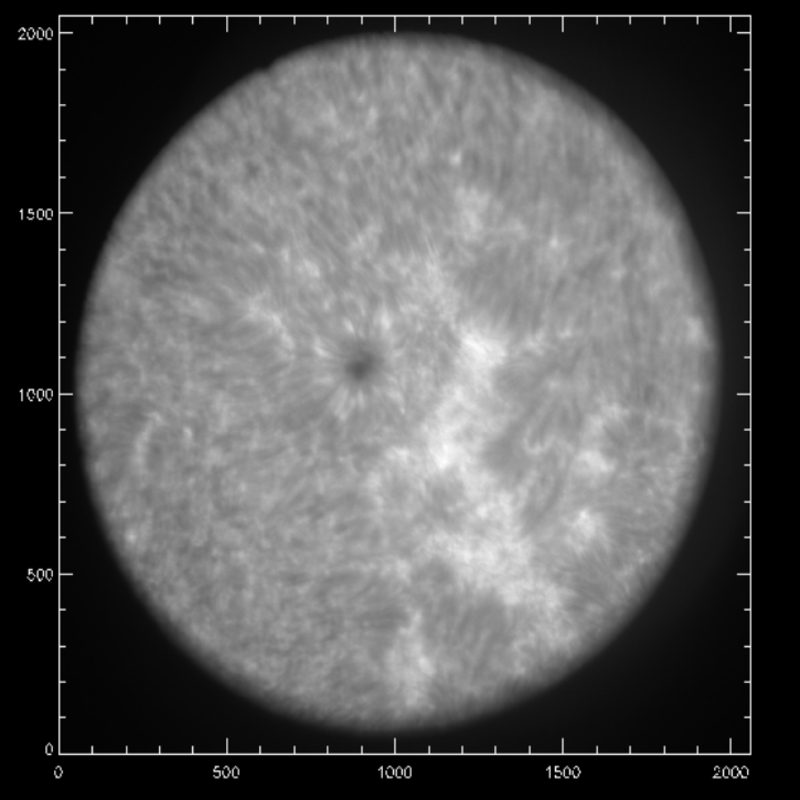
A raw image taken in Ca 8542 Å spectrum line on 28/04/2017 from MAST at USO
The Sun is the powerhouse sustaining life on Earth and providing most of the energy. It is the only star in the Universe which is close enough for us to study and reveal details about its surface. Its basic properties provide benchmarks and boundary conditions for the study of stellar structure and evolution. This project was a preliminary analysis of solar images which involved processing the images to remove noise signals, account for inaccurate measurements for studies pertaining to solar flares and analyze and measure the velocity shifts in Calcium lines in chromosphere. The images used in this project were taken by a 50 cm aperture Multi Application Solar Telescope (MAST) with G-Band and H-alpha filters at Udaipur Solar Observatory, India.
The photographed images (also known as light frames) are usually very noisy which needs to be corrected using right statistical methods. One such pre-processing technique I used was flat-field and dark field corrections. For charged-coupled devices (CCD), used for solar studies in different wavelengths, the pixelized images are not always perfectly even but contain ‘dark’ or ‘hot’ pixels. This either leads to underefficiency (due to fabrication artifacts) or produces high readout currents (because some electrons are not properly flushed after CCD readout). Such uneven sensitivity across the CCD area can be compensated by subtracting a “dark current” image.
The chromosphere traditionally refers to the layer seen outside the solar limb, emitting intense light in the Hα line and in the visible and near-infrared spectra. The preprocessed corrected images were then used to plot intensity functions against wavelengths to measure the velocity (Doppler) shifts in the Ca II line in the chromosphere. These profiles shows the plasma flowing either upwards or downwards, which may help in studying shock waves and infer their temperature. After correcting the images, we then used the data for image registration to study the cross-correlation and observe the motion in any of the visible feature of the Sun. All the dynamics of solar activity and results were studied and analyzed by visualizing the data through animation.